Yo, wanna level up your trading game? Get ready to unlock the secrets of Fibonacci trading, a technique that’s been used by seasoned traders for years to find those sweet, sweet profit opportunities. We’re talking about combining Fibonacci retracement levels with supply and demand analysis – think of it as the ultimate trading power couple.
It’s like having a crystal ball, but instead of seeing the future, you’re seeing the perfect time to buy low and sell high.
We’ll break down everything you need to know, from the basics of Fibonacci sequences to how to spot those juicy supply and demand zones. We’ll even throw in some real-world examples to make sure you’re ready to take on the markets like a pro.
So buckle up, buttercup, and get ready to learn how to dominate the trading world with Fibonacci and supply/demand analysis.
Understanding Fibonacci Trading
Fibonacci trading is a popular technical analysis technique that uses the Fibonacci sequence to identify potential support and resistance levels in financial markets. The Fibonacci sequence is a series of numbers where each number is the sum of the two preceding numbers.
It begins with 0 and 1, and continues as follows: 0, 1, 1, 2, 3, 5, 8, 13, 21, 34, 55, 89, 144, and so on.
Fibonacci Retracement Levels
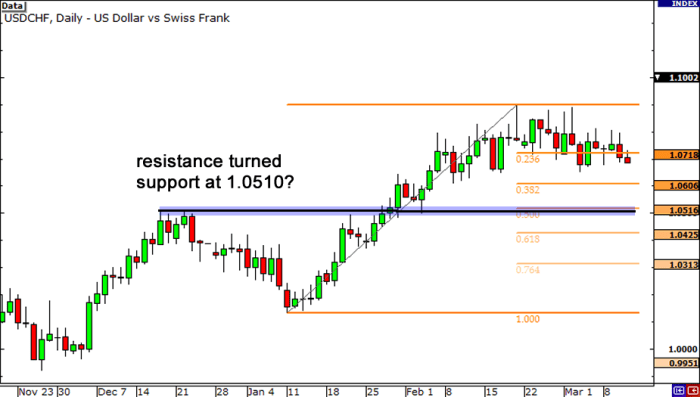
Fibonacci retracement levels are used to identify potential support and resistance areas in a price chart. They are calculated by dividing the difference between a high and low price by specific Fibonacci ratios, such as 23.6%, 38.2%, 50%, 61.8%, and 100%.
These ratios are derived from the Fibonacci sequence, and are believed to represent natural points of price reversal.
For example, if a stock price rises from $100 to $150, the difference between the high and low price is $
50. The 23.6% Fibonacci retracement level would be calculated as follows
$50 x 0.236 = $11.80
The 23.6% retracement level would be located at $138.20 ($150
$11.80).
Using Fibonacci Levels to Identify Support and Resistance
Fibonacci retracement levels can be used to identify potential support and resistance areas in a price chart. When the price of an asset is moving in a certain direction, it is often expected to retrace a portion of its previous move before continuing in the same direction.
Fibonacci retracement levels are used to identify these potential retracement points.
- Support Levels:When the price of an asset is falling, Fibonacci retracement levels can be used to identify potential support levels. If the price falls to a Fibonacci retracement level and then bounces back up, it suggests that the level is acting as support.
- Resistance Levels:When the price of an asset is rising, Fibonacci retracement levels can be used to identify potential resistance levels. If the price rises to a Fibonacci retracement level and then falls back down, it suggests that the level is acting as resistance.
Using Fibonacci Retracement Levels to Identify Entry and Exit Points
Fibonacci retracement levels can also be used to identify potential entry and exit points in a trade.
- Entry Points:When the price of an asset is falling, traders may look to enter a long position at a Fibonacci retracement level. This is because the level may act as support and prevent the price from falling further. Conversely, when the price of an asset is rising, traders may look to enter a short position at a Fibonacci retracement level.
This is because the level may act as resistance and prevent the price from rising further.
- Exit Points:Fibonacci retracement levels can also be used to identify potential exit points in a trade. Traders may choose to exit a long position when the price reaches a Fibonacci retracement level, or they may choose to exit a short position when the price falls to a Fibonacci retracement level.
Supply and Demand in Trading
Supply and demand are the fundamental forces that drive price movements in financial markets. They represent the interaction between buyers and sellers, with buyers wanting to purchase assets at lower prices and sellers wanting to sell at higher prices. The balance between these two forces determines the equilibrium price of an asset.
Understanding Supply and Demand Dynamics
Supply and demand dynamics are constantly shifting, influencing price movements in various ways.
Fibonacci trading, support and resistance, supply and demand – it’s all about reading the market like a detective. You gotta know your numbers, your patterns, and your psychology to make a killing. But sometimes, the market throws you a curveball, like the chilling story of AXED! The 1980 Amana Iowa Ax Murders , where the seemingly peaceful community was rocked by a brutal crime.
Just like in the market, you never know when things will take a turn for the worse, so always be prepared, and never underestimate the power of knowledge and foresight. Master those Fibonacci levels, and you’ll be on your way to making some serious dough.
- Increased Demand:When demand for an asset increases, buyers are willing to pay higher prices to acquire it, leading to a price increase. This is because a higher demand means more buyers are competing for a limited supply, pushing prices upwards.
- Decreased Demand:Conversely, when demand decreases, buyers are less willing to pay high prices, resulting in a price decrease. This is because fewer buyers are competing for the available supply, leading to a downward pressure on prices.
- Increased Supply:If the supply of an asset increases, sellers may need to lower their prices to attract buyers, causing a price decrease. This is because a higher supply means more sellers are competing to sell their assets, putting downward pressure on prices.
- Decreased Supply:A decrease in supply can lead to a price increase as sellers can demand higher prices due to the scarcity of the asset. This is because fewer sellers are competing to sell their assets, allowing them to set higher prices.
Identifying Supply and Demand Zones
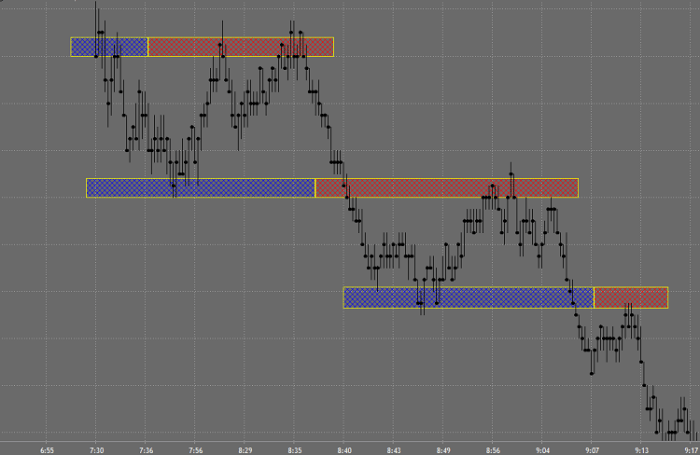
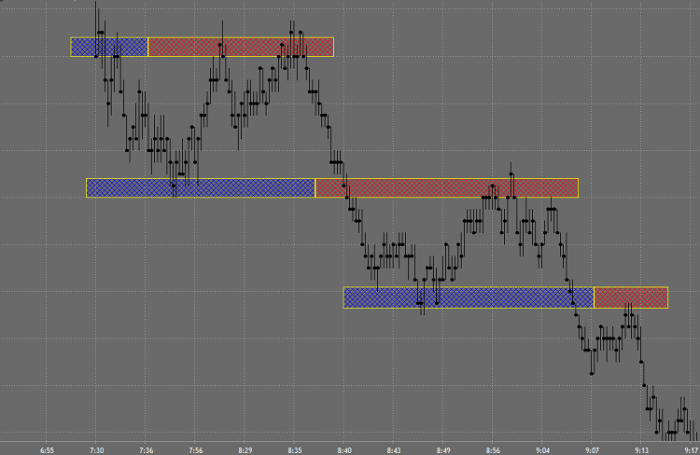
Identifying supply and demand zones on a price chart is crucial for traders as they represent potential areas where price reversals might occur.
- Supply Zones:These are price levels where selling pressure is strong, indicating that sellers are more likely to dominate the market. When the price reaches a supply zone, it might face resistance and potentially reverse downwards.
- Demand Zones:These are price levels where buying pressure is strong, indicating that buyers are more likely to dominate the market. When the price reaches a demand zone, it might find support and potentially reverse upwards.
Integrating Fibonacci and Supply/Demand
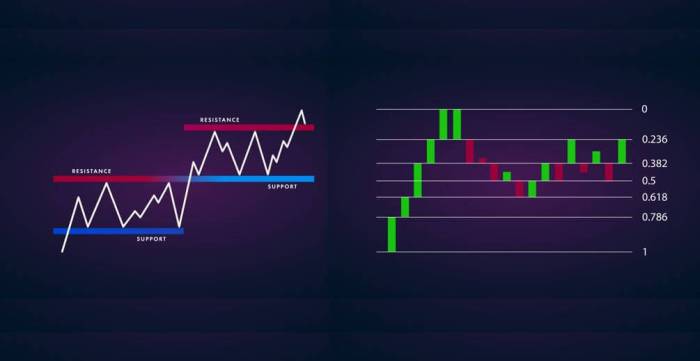
Think of Fibonacci and supply/demand as the dynamic duo of trading. They’re like Batman and Robin, each with their own unique strengths, but together they form an unstoppable force. Fibonacci levels give us clues about potential price reversals, while supply and demand zones reveal areas where buying or selling pressure is likely to be strong.
By combining these two powerful tools, we can identify high-probability trading opportunities that are more likely to lead to profits.
Using Fibonacci Retracement Levels to Identify Supply and Demand Zones
The magic happens when we use Fibonacci retracement levels to pinpoint potential supply and demand zones. These zones are like invisible walls that often cause price to bounce back. When price approaches a Fibonacci retracement level that coincides with a supply or demand zone, it’s like a double whammy for potential reversals.
This is where the real money-making opportunities arise.
“Fibonacci retracement levels are based on the Fibonacci sequence, a series of numbers where each number is the sum of the two preceding ones (e.g., 0, 1, 1, 2, 3, 5, 8, 13). The most common Fibonacci retracement levels used in trading are 23.6%, 38.2%, 50%, 61.8%, and 100%.”
Examples of Identifying High-Probability Trading Opportunities
Let’s say the price of a stock is trending upwards. It then experiences a pullback. Using Fibonacci retracement levels, we can identify the 38.2% retracement level. If this level coincides with a previous demand zone (where buyers were strong), we have a high-probability setup for a potential long entry.
Alternatively, if the price of a stock is trending downwards and then rallies, we can identify the 61.8% retracement level. If this level coincides with a previous supply zone (where sellers were strong), we have a high-probability setup for a potential short entry.
Steps for Executing the Integrated Strategy
- Identify the trend.Is the price trending upwards or downwards?
- Determine the recent swing high or swing low.This will be your starting point for calculating Fibonacci retracement levels.
- Apply Fibonacci retracement levels.Calculate the 23.6%, 38.2%, 50%, 61.8%, and 100% retracement levels.
- Identify supply and demand zones.Look for areas where price has previously bounced off or broken through. These zones often represent areas of strong buying or selling pressure.
- Look for coincidences.When Fibonacci retracement levels coincide with supply and demand zones, it creates high-probability trading opportunities.
- Place your trades.Enter long positions when price approaches a Fibonacci retracement level that coincides with a demand zone. Enter short positions when price approaches a Fibonacci retracement level that coincides with a supply zone.
- Set your stop-loss and take-profit levels.Use technical indicators or risk management strategies to determine appropriate stop-loss and take-profit levels.
Book Review
This review dives into the fascinating world of “Trading in the Zone” by Mark Douglas, a classic in the realm of trading psychology. While not directly focused on Fibonacci trading or supply and demand, it delves into the mental aspects of trading, which are crucial for success in any trading strategy, including those incorporating Fibonacci and supply/demand concepts.The book explores the psychological barriers that often prevent traders from achieving consistent profitability.
Yo, wanna level up your trading game? Fibonacci trading, support and resistance, supply and demand – these are the moves that separate the pros from the noobs. But before you go making those big bucks, make sure you’ve got your paperwork straight! Check out the One Per Page Notary Journal – it’s like a cheat sheet for keeping your notary acts in order, with one record entry per page.
You know, so you can focus on those sweet, sweet profits. Get that dough, my friend!
Douglas emphasizes the importance of developing a mindset that embraces risk and uncertainty, while also understanding the emotional and psychological factors that can derail trading decisions.
Key Concepts and Applications
The book’s core concepts can be applied to real-world trading scenarios involving Fibonacci and supply/demand strategies. Here are some key takeaways:* Understanding Risk and Uncertainty:Douglas argues that trading is inherently risky and involves a level of uncertainty. By accepting this reality, traders can develop a more objective approach to decision-making, reducing the impact of emotional biases.
Developing a Trading Plan
The book stresses the importance of having a well-defined trading plan that Artikels entry and exit points, risk management strategies, and psychological considerations. This plan serves as a framework for making consistent and disciplined decisions.
Managing Emotional Biases
Douglas discusses common emotional biases that can hinder trading performance, such as fear, greed, and overconfidence. He provides strategies for identifying and mitigating these biases to improve decision-making.
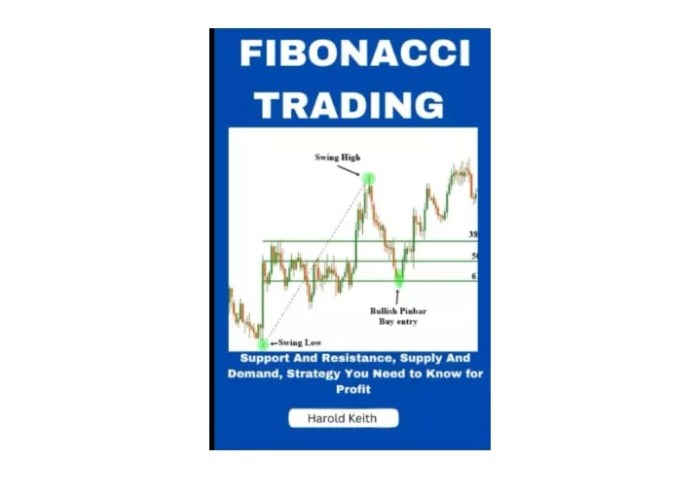
Yo, wanna level up your trading game and finally crack the code to those sweet, sweet profits? Check out this killer Fibonacci Trading Support and Resistance Supply and Demand Strategy, it’s the real deal. You can Download And Listen Here to get the lowdown on how to use Fibonacci levels, support and resistance, and supply and demand to make bank.
This strategy is the secret weapon you need to dominate the market and become a trading legend.
The Importance of Discipline
Consistent profitability in trading requires discipline. This includes sticking to the trading plan, managing risk effectively, and avoiding impulsive decisions driven by emotions.
Yo, wanna level up your trading game? Fibonacci sequences, support and resistance, supply and demand – it’s all about mastering the fundamentals. Think of it like Kobe’s playbook – he didn’t just show up and ball, he studied, practiced, and honed his skills.
Check out What Kobe Left Behind The Playbook from an Extraordinary Life for some serious inspiration. Once you’ve got those trading fundamentals down, you’ll be making moves like a pro, just like Kobe did on the court.
Focus on the Process, Not the Outcome
The book emphasizes the importance of focusing on the trading process rather than the outcome. This involves making sound decisions based on the trading plan and accepting that losses are an inevitable part of the trading journey.
“The market is not a person. It doesn’t have feelings or intentions. It’s simply a mechanism for allocating resources.”
Mark Douglas
These concepts, when applied to Fibonacci and supply/demand trading, can help traders develop a more robust and disciplined approach. By understanding the psychological factors that influence trading decisions, traders can make more rational choices based on objective analysis, rather than emotional impulses.
Outcome Summary
By mastering the art of Fibonacci trading and understanding the dynamics of supply and demand, you’ll be equipped with the tools to make smarter, more informed trading decisions. This isn’t just about flipping charts, it’s about understanding the underlying forces that drive market movements.
Think of it as a cheat code for the financial game, giving you the edge you need to turn your trading into a serious money-making machine.
Key Questions Answered
Is Fibonacci trading a guaranteed way to make money?
No, like any trading strategy, Fibonacci trading doesn’t guarantee profits. Market conditions can change, and there’s always risk involved. However, it’s a powerful tool that can help you make more informed decisions.
What are some good resources to learn more about Fibonacci trading?
There are tons of resources out there! You can find books, online courses, and even YouTube videos dedicated to Fibonacci trading. Do your research and find what works best for you.
Can I use Fibonacci trading for all types of markets?
Yes, Fibonacci trading can be applied to various markets, including stocks, forex, and cryptocurrencies. However, the specific levels and strategies may vary depending on the market.
Is Fibonacci trading only for experienced traders?
Not at all! While experienced traders can leverage Fibonacci trading to a greater extent, it’s a valuable tool for beginners as well. Start by learning the basics and gradually expand your knowledge.

